Cash-Flow Factor Faded as Gross Profit Held
A sweep of 86,400 profitability-factor series found that the strongest lifetime result turned negative after 2010, while gross profitability stayed positive across three eras.
This article compares five definitions of profitability across 86,400 tested factor specifications covering 1960 through 2024. One result organizes the rest: cash-flow-to-market, the strongest definition over the full history, turned negative after 2010, while gross profitability stayed positive in every era. The choice of definition now carries as much weight as the decision to use profitability at all.
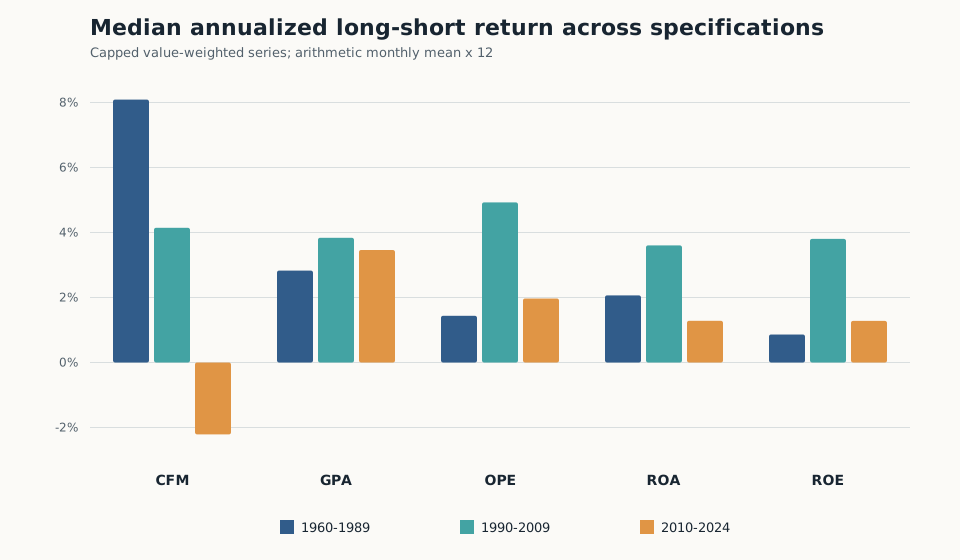
Cash-flow-to-market led five profitability measures over the full 1960–2024 record, then broke down in the most recent 15 years. Its median capped value-weighted return fell from 8.1% a year in 1960–1989 to 4.1% in 1990–2009 and negative 2.2% in 2010–2024. Only 3.9% of the factor’s tested specifications remained positive in that last period.
Gross profitability held a narrower range. Its median annualized return came to 2.8%, 3.8% and 3.5% across the same three eras, with at least 99.8% of specifications positive in each one. Operating profitability also stayed positive. Return on assets and return on equity weakened in the latest period while retaining positive median results.
The split matters because “profitability” covers several economic claims. Return on equity can rise when leverage makes the equity base smaller. Return on assets uses a broader capital base and can penalize companies whose most important assets never reach the balance sheet. Gross profitability measures the strength of sales before much of the operating cost structure, while operating profitability asks how much strength survives those costs.
Cash-flow-to-market adds another moving part: price. Its denominator brings market valuation into the signal, leaving the historical return exposed to changes in both company cash generation and what investors were willing to pay for it. The post-2010 reversal marks a regime break in the tested series. The analysis does not identify whether valuation, industry composition, crowding or another exposure drove it.
Construction choices widened the differences. For capped value-weighted return on equity, the median full-history return was 3.8% with a three-month information lag, 2.4% with a six-month lag and 0.8% under the library’s Fama-French timing convention. Sorting companies into ten portfolios also produced larger high-minus-low spreads than sorting them into three.
Those choices define when an accounting value becomes tradable and how extreme the comparison becomes. A thinner top and bottom group can produce a cleaner test of the characteristic while adding concentration and implementation risk. A longer lag reduces the chance that a backtest uses information before publication, though excessive delay can move the test away from the information investors actually had.
The full-period numbers still favored profitability. Median capped value-weighted annual returns ranged from 1.8% for return on equity to 4.5% for cash-flow-to-market. The era results put a harder condition on that finding: the definition that won the lifetime comparison also suffered the clearest recent failure.
Gross profitability’s steadier record gives the family its strongest robustness result. It also sets the burden for future factor claims. A long history earns less weight when one era supplies most of the premium.
Explore the full robustness dashboard → See the median and 10th–90th percentile range for all five factors across every era, plus the methodology sensitivity breakdown behind these numbers.
Sources
- Tidy Finance Factor Library, U.S. long-short portfolio returns derived from CRSP and Compustat, 1960–2024.
- MarketBrain factor-library pilot: 86,400 series across ROA, ROE, gross profitability, operating profitability and cash-flow-to-market; arithmetic monthly means annualized by 12.